
Steve Stark presented the FlightStats data set, for data about flights made available to 3rd party applications (including tripchi!). He explained that about 80-100k flights a day are taken, and gave a few examples of what you could do with the data: you can track your flight, see if it’s on time, see where your baggage is coming in, etc. FlightStats made the 2011 data-set available, including flight history data about airlines (code share info but not tail number), airports (ICAO), departure and arrival, and aircraft type and features (including number of seats, capacity, etc. to determine where are airlines underserving). Other items that the data set tracks includes published departure through the Global Distribution System (GDS), updated schedule with variance, and actual departure time. This leads to interest analysis, such as running an assessment of scheduled versus actual (outside a specific window) across all flights, where patterns could potentially emerge around airport, time of day, aircraft type, etc. You could also look at the difference between when the plane left the gate and when it actually left the runway. In fact, this was one of the original ideas that team Data Slaves came up with – figure out how much “captive” time that passengers spent sitting on the plane between leaving the gate and actually taking off, and figuring our innovative ways to engage with and market to them.
Next, Tadgh Pierson presented from Amadeus, which made available its Master Pricer search request data. This was the worldwide search requests from April to October 2011. including: date and time of search, overall origin destination, the detail of each flight leg requested, whether it was a roundtrip or not, inclusive of legs etc, date of departure, preferred carrier, and low fare search requests. The Master Pricer software searches worldwide to every destination, but the data-set made available is mainly Europe and Asia, used mostly by travel agents. Things to be aware of with this data-set: searches can be city or airport, the search date may not be same as the local date where the search occurred (UTC time), and this data includes travel searches only and not actual bookings and only covering flights (no hotel etc). He reminded us to keep in mind the long buying cycle for a flight – in fact, 38 searches are done on average before booking, inclusive of robot data (spambots).
Another data set made available to us is ARC – which is a financial clearing house between financial agencies and airlines. Travel agency ticket bookings are settled and then processed through ARC’s 14k travel agents, so it’s really a global industry warehouse for tickets. ARC has partnerships with IATA that does settlements everywhere else. Annually 700m flights are recorded into the database, and. 1.2B flights into the DB. The data made available to us by ARC was global tickets in 2011, including 40k daily data feeds but not from everywhere, including ticket days at the flight coupon level of data. Journeys are captured involving trips (one way) containing flights (stops), segments, and destinations. Trip journey or round-trip is issued a unique ID, with trips, origin, destination, time, and date. Primary cabin class – first, business, coach, and discount coach – are also listed, as well as route breakout, carrier breakout, and average fare by class. Finally, also included is the fare versus document amount (what the passenger paid). A ticket in this case is one passenger in one seat, not including last minute upgrades etc., but can include tickets usages for exchanges.
The last data set available to us was the Travelport data set, presented by Abdoul Sylla, Jinane Abounadi and Ted Beatie. Travelport made available flight search/shopping data from September. Travelport included data about the route bookings, destination, arrival, airport codes, ticket identifier, route breakout, average fare, class of service etc. – that were part of the result served back to the customer by the travel agency (but not necessarily booked). The shopping process begins with customers specifying where they want to go (and when), and then Travelport executes the search and produces up to 100s of itineraries between the city-pairs. Finally, the travel agency displays the results to its customers.
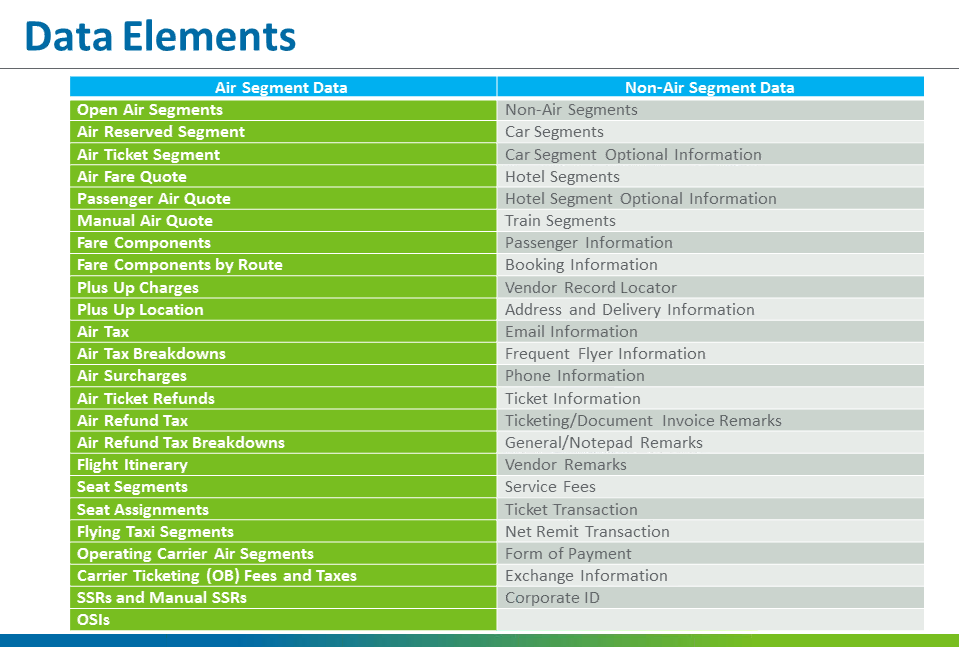
Travelport is a leading distribution services and e-commerce provider for the global travel industry, and connects buyers and sellers through agency, online and corporate travel channels. Their Universal API is offered in 88 countries, across 1,500 users, and uses web services technologies to support data transfer between client travel applications and a variety of providers and suppliers. FYI – they have a really robust developer network that you can explore here, and request a 30-day trial access to their Sandbox…including all of the sexy data you see below:

Ryan Fishel
Alfredo Gómez Castillejos
Duke Atkinson
Javier Buitrago
Tarit Mitra
Ramanathan Subramanian
David Roberts and you can also read his blog on the event here
We had a smattering of skill-sets across the board, including software engineers, data scientists, designers, marketers, consultants, and entrepreneurs, many with travel industry experience – which gave us extreme breadth and a high-knowledge base to draw from as we delved into the depths of Big Data. Here is the Data Slaves hard at work:

In terms of the technology that hack/reduce made available to us – we got to geek out with a cluster of 20 nodes with 32GB RAM, 4 CPU cores, 300GB disk space, a 10 node elastic search cluster (one node given out per team), and 1 Redis instance. Our team ultimately was assigned an ssh key into that node, where we used Elastic Search instance of Redis. We wrote code locally on the node and used the local data sets made available on our node for testing. Finally, we uploaded our code jar using scp. We chose Python as our scripting language.
We decided to solve the problem of when to book travel depending, not only on price, but also availability, class, capacity and other factors. The customer use case would be: “Thanksgiving is coming up. How many days in advance should I book my travel to get MY optimal, personalized flight bundle.” This doesn’t just mean lowest price, but could also mean “optimal seat on the plane”, “desired cabin”, and “an empty middle seat next to me.” Price will largely be the greatest factor/influences, but there are other factors that must also be considered in reducing the Hipmunk-like level of agony that passengers must face today.
To solve this problem, we ended up using mainly three of the four data sets, namely: Travelport for searches (queries), Amadeus for responses (results), and ARC for bookings (prices). We arbitrarily linked these data sets together in time and date, assuming that in real-life, matching data sets would easily be obtained. Normalizing the data took some time, because we next had to massage the data sets to match up specific attributes and then scale them in the right way. Finally, once the sets were normalized, we set them up in Elastic Search so that they could be queried in a quick manner. This took the majority of the hackathon, and, as it turns out, we didn’t have as much time left for visualization as we would have liked. However, we still were able to do some quick trend analysis and graphical displays, and you can see from our prezi below.
Even though we didn’t get as far as we would have liked on our visualizations, we ended up doing something with each data set (including an awesome visualization by Javier), and set up the model such that, had we more time, we could have easily searched through the data we had using Elastic Search to pull out what we needed, do statistical analysis, and look for trends.
Read more about the winning teams here. Congratulations to everyone who won, and even to those who participated. Surviving was a prize in and of itself.
One response to “Tnooz Big Data Travel Hack”
Awesome! This is great! It was awesome working with you guys. Hope to get together soon.