Last week, Hopper put out a pretty nifty infographic showing average flight prices by airport. The default search shows us USA as the “home airport” – which is a bizarre and useless concept since USA is a country obviously and decidely NOT an IATA airport code. Just the same, the data behind these flight prices by airport it is kind of useful. What Hopper does, is averages every flight in the US to the middle of no where USA (Wyoming), and then spits out the average flight price, which is $513.
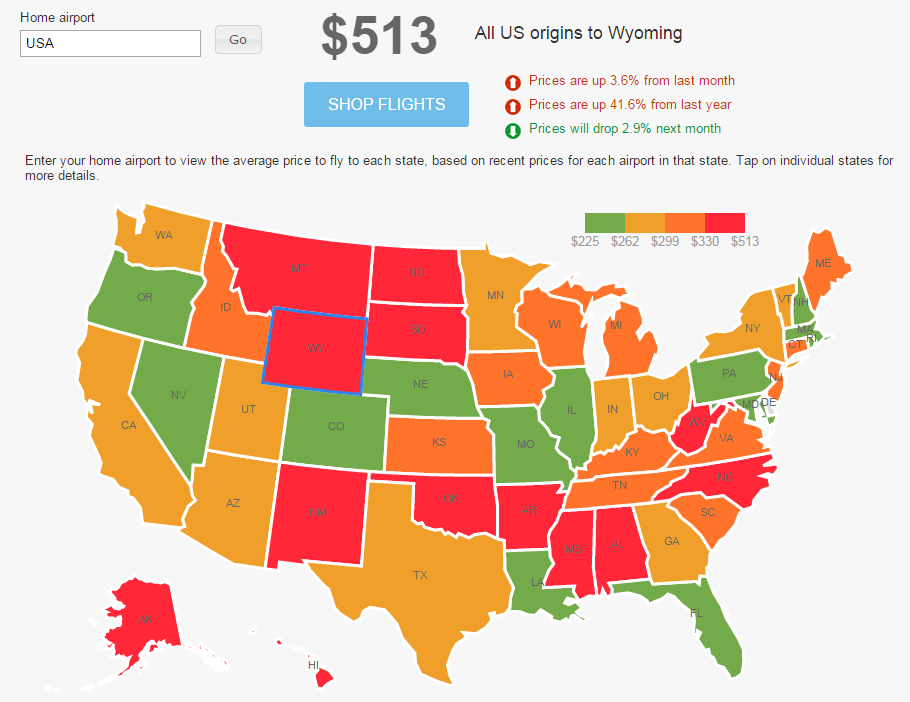
There are also a couple other key pieces of data for each search that Hopper gives us for flight prices by airport are:
- A comparison to last month
- A comparison to last year
- A forecast for next month
Taking our middle of nowhere Wyoming example (sorry Wyoming), prices are looking 3.6% worse than last month and 41.6% worse than the same time last year, and are predicted to drop 2.9% next month. So, the advise is to WAIT to fly to Wyoming until next month, nobody where you are flying from. Of course, these flight prices by airport results are generalized.
That said, let’s take a look at a more specific use case of flight prices by airport. For this example, let’s take DEN to California, a a route a fly often (since I fly to LAX and BUR at least 3 times a year – check out my Spirit, Frontier, and United reviews if you don’t believe me).
The average price for a flight from DEN is $205 – this checks with my gut. I can usually wrangle a flight to LA on a Low-Cost Carrier (Spirit, or Frontier, e.g.) for $150.
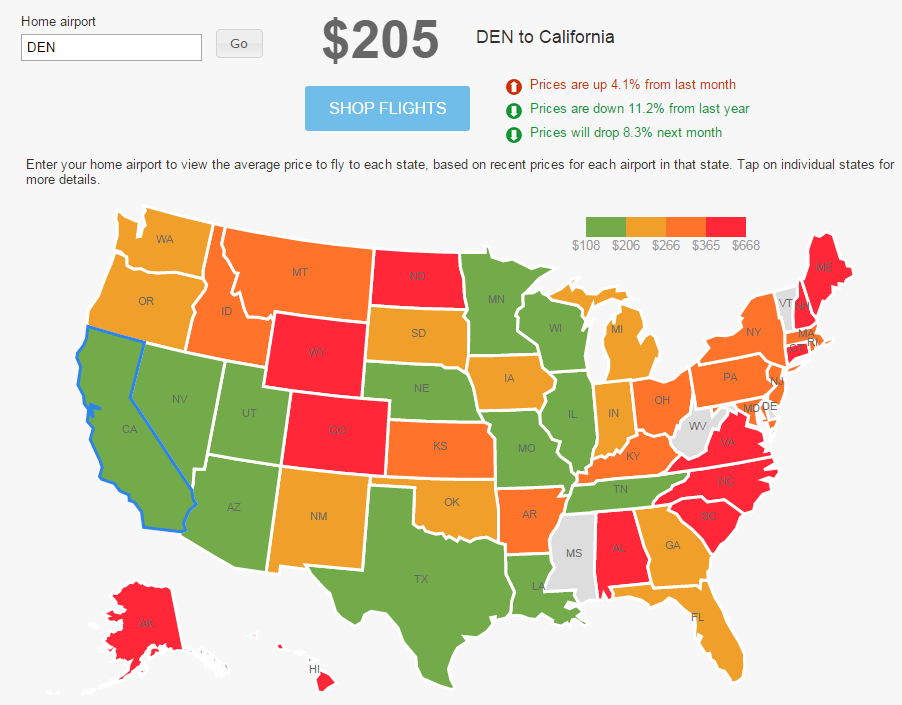
Flight prices by airport (DEN to California use case) are up 4.1% from last month (i.e. are more expensive), but are down 11.2% from the same time last year (are cheaper), and are predicted to drop 8.3% next month. While this doesn’t actually give me a farecast mechanism for planning my holiday travel, it does tell me that next month is a good time to visit California (which I was planing to do anyways), and that generally this year is cheaper than last year. This makes sense – and I actually took more trips to LA this year than I did last year, partially due to lower fares.
The final piece of data Hopper shares with us is how expensive our home airport is to fly OUT OF relative to all other states in the US. DEN seems to have a variety of both inexpensive and expensive state options. What’s kind of odd is the pricing meter doesn’t track with airline hubs that call DEN/Colorado home. For example, I would expect all United hubs attached to DEN as our airport selection to be “green” – these include Virginia (IAD hub), Illinois (ORD hub), Texas (IAH hub), California (LAX and SFO hub), New Jersey (EWR hub). Of these, all almost all are…except NJ and VA. It certainly explains why my DEN to California use case and flights are always so cheap.
I would certainly be interested to hear from Hopper a little more of the data science and explanation behind the colors on this map. Certainly, this flight pricing by airport interactive map is quite interesting – perhaps even useful.
Let us know if you end up using it, and if so – how!